Census Figures Show Statistical Case for Building More Housing
Annual Home Permit Figures Convey That the More a Metro Builds, the Lower Its Median Prices.
 Early each year, the Census Bureau releases data that is crucial in understanding America’s affordable home shortage. Called the Building Permits Survey, it shows the number of home permits issued by metro area, with 1 permit equaling 1 unit (ergo multifamily buildings account for multiple permits). The 2019 data came out in early February, showing just how much—or little—some metros build relative to their population. My own number crunching reveals how these trends affect their elasticity and affordability.
One interesting thing about the 2019 data is that it’s scarcely different from the previous annual data, which is available on the Census website dating back to 2004. In almost every year since then (save the years during and after the recession), metro Houston, Dallas, and New York City were by far the top permit issuers, usually ranging from 40-80k per year. Metro Los Angeles, Phoenix, Atlanta, Seattle and Washington, DC, have been the second tier, generally issuing between 20-40k. Many of the metros considered top examples of Nimbyism—San Francisco, Boston, San Jose, Portland—often issue below 20k permits, and sometimes even down into the 4 figures.
Does that mean their high home prices can be blamed on under-building? Yes, although the data should be parsed a bit more.
A better way to judge a metro’s true elasticity (a term used to describe construction activity relative to demand) is to measure permits per 10,000 residents. That makes it easier to compare different-sized metros. For example, metro Houston and New York City both issued around 61k permits in 2019. But metro New York City is nearly 3 times bigger than metro Houston, meaning its construction activity in 2019 (30.4 permits per 10k residents) was much less than Houston’s (88.3 permits per 10k).
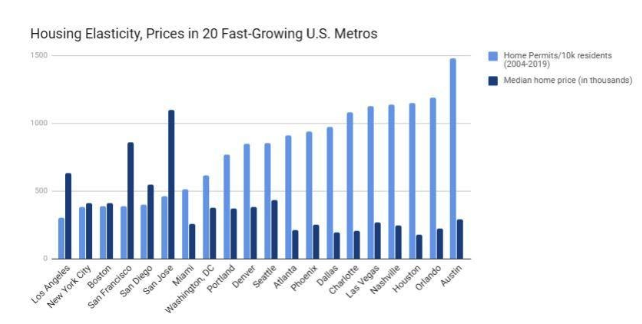
As you can see in the graph above, I crunched the permits per 10k residents for 20 metros between the 2004-2019 timeframe provided by the Census. The common denominator of the 20 metros I chose was their fast growth rates and high demand. So my analysis includes Sunbelt metros, along with globally-renowned East and West coast ones. I excluded slow-growing Rust Belt metros like Chicago and Philly, which have less demand and thus aren’t comparable.
What I found is that metros known for their Nimbyism do, in fact, have a decade-plus track record of underbuilding. The 6 least-elastic metros on my chart—Los Angeles, New York City, Boston, San Francisco, San Diego, and San Jose—read like a who’s who of Nimby metros. At the top end of the graph are famously elastic markets like Houston, Dallas, Phoenix, and Orlando.
Inversely, median home prices are negatively correlated to construction activity. Although there’s slight variation in my graph, the fewer permits a metro issues, the higher its median home prices generally are—and vice versa. Really, the correlation is striking. Based on Kiplinger’s ranking of median home prices, the 9 most elastic of my 20 metros had home price medians below $300k. 10 of the 11 least elastic metros had home price medians above $300k—often extremely so. Miami was the only one of these 11 that didn’t exceed $300k, but is still considered a very expensive market when controlled for median income.
The takeaway is clear. Rather than the myth that cities “can’t build their way out of the affordable housing crisis”—and might as well not even try—some metros have accomplished just that. They’ve grown quickly in jobs and population, but have permitted lots of housing in the last 16 years, thus stabilizing their prices. Price medians don’t rise particularly fast year-over-year in these metros, nor do they get too high overall. It’s time for expensive coastal metros like New York and San Francisco to observe these Census trends and start permitting more housing.