See How Little Housing Some U.S. Metros Permit
The supply is not meeting demand
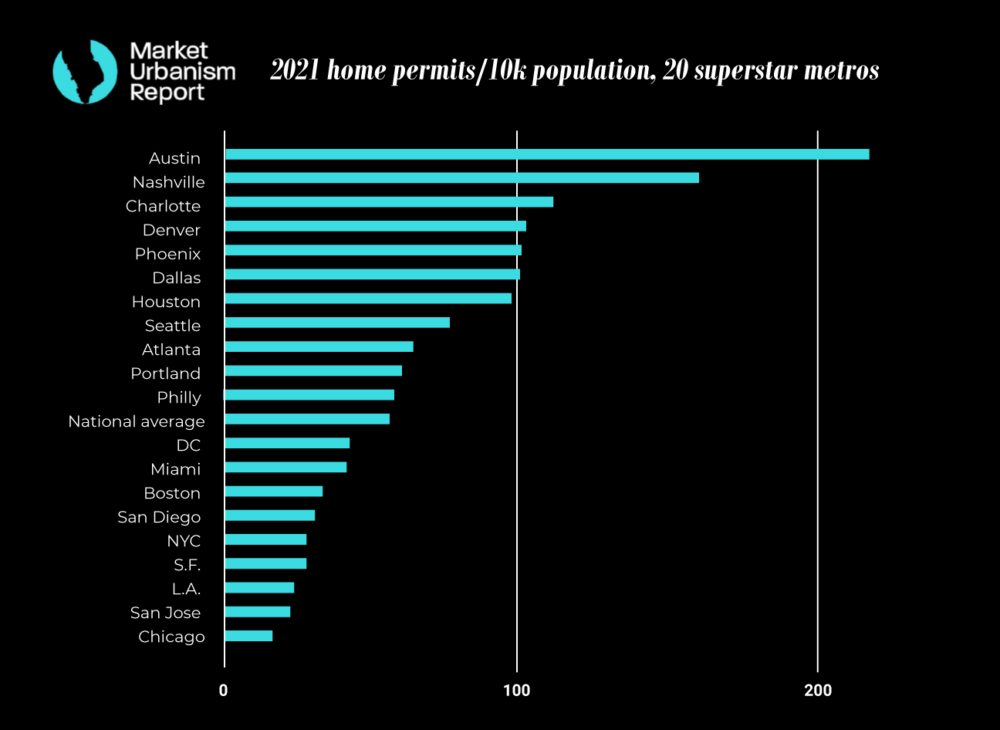
Every winter, the Census Bureau releases home permit figures for every metro nationwide from the year prior. These are a useful way of tracking not just how much housing is built, but the overall economic dynamism plus affordability in each metro. We have for years crunched the numbers, calculating permits per 10,000 people in 20 superstar metros. By “superstar,” we mean ones that have fast growth, economic relevance, or a global reputation. The results are always as telling as they are predictable.
Our 2021 findings are in fact nearly identical to years prior. The Sunbelt dominates the top of the list; Austin leads, with 216 permits issued per 10,000 people, followed by Nashville (116), Charlotte (112), Denver, then Phoenix, Dallas and Houston. At the bottom of the list are high demand, mostly coastal metros where home prices are consequently high.
How the data is collected
The Census calculates permits by asking permitting authorities to report the number of new units built. When authorities do not respond to the request, Census officials make the calculation through a separate process known as the Survey of Construction, which tracks construction of single- and multi-family homes in the U.S., or “imputed based on the assumption that the ratio of authorizations for the current time period to the prior year total is the same for reporting and nonreporting jurisdictions in that Census Region.” The total number of regions with collected permits is 20,100.
According to the Bureau, just under half of the jurisdictions observed conduct their assessments every month; most conduct them once a year. The data come from “individual permit offices, most of which are municipalities.
The Connection to Housing Costs
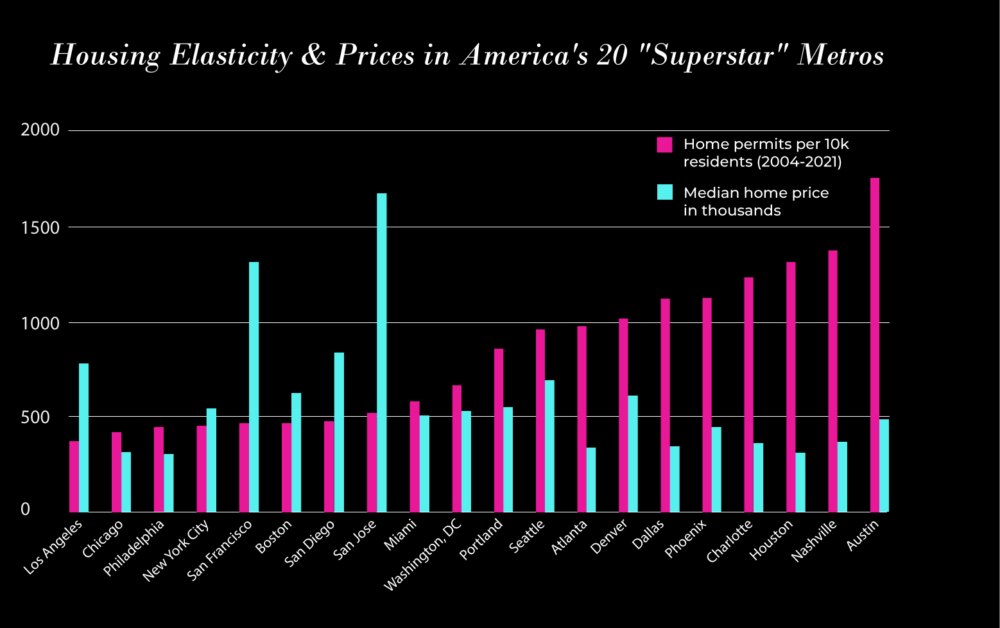
Looking at the above graph, it is clear that metros with more permitting generally keep costs lower than those which do not. Looking at average rents, the case tends to be the same. The average rent in metro Charlotte is $1,693. In Los Angeles, it is $2,946, or 74% higher. Yet the former has faster population growth than the latter, growing 11% from 2019 to 2022, while the Los Angeles region’s population only grew 0.32% in that time period.
New York City and San Francisco, some of America’s highest-demand metros, are tied at a mere 29 permits per 10,000 residents, and the anchor cities both have some of the nation’s highest average rents: $3,595 and $4,060, respectively. San Jose, center of Silicon Valley, is the second-lowest metro for permitting among the 20, and in the city, a studio apartment will rent for about $2,500.
Metro Chicago and Philadelphia are near the bottom of these lists, despite having lower median rents and home prices than New York City. But their metro populations have been fairly static over the decades, so prices do not grow very quickly, either.
Some critics of our annual permitting research, which is conducted for Market Urbanism Report, charge that the connection between permitting and prices is inexact. Austin, for instance, is by far the most permissive of the 20 metros, but local home costs are still soaring. However, the median home price there is still lower than many peer superstar metros that attract an upscale clientele. Moreover, it is worth noting that the growth has been uneven. In areas where construction happens, such as northern suburbs like Pflugerville, prices are in fact much lower than the area median. In parts of Austin where NIMBYism is strong, such as the city core, this gets reflected in higher prices.
A somewhat common argument holds that Sunbelt markets are able to keep prices low because they sprawl. This may be true, and has the effect of lowering price pressure on the infill areas, too. For example in downtown Houston, high-end studio apartments can be rented for as low as $1,200/month, while in New York City, one needs to travel considerably far from Manhattan to find comparable rents. Houston has also taken steps to deregulate this type of housing. Research by the Upjohn Institute supports our thesis, finding that new construction in markets ranging from Atlanta to Los Angeles to Philadelphia slowed down rent increases.
But overall housing prices keep rising in America, and there is by some counts a national home shortage of 5 million. Our data shows which metros have and have not adequately worked to address this, and how it impacts prices within those metros. High-demand metros that do not permit much housing have high costs. High-demand metros that take a permissive approach have kept rents and median sales prices lower than their counterparts. The answer to our housing-related problems is right in front of us.
This article featured additional reporting from Market Urbanism Report content staffer Ethan Finlan.